
Blog
Answer Engine Optimization vs Traditional SEO: What AEO and GEO Add and Where They Overlap
Position-1 CTR fell 58% when AI Overviews appear. Learn what AEO and GEO add to SEO, where they overlap, and how to frame the budget case for a CFO.
Build a defensible AEO investment model: break-even deals, 90-day leading indicators, revenue at risk, and a kill criterion finance will accept.

Position-1 CTR fell 58% when AI Overviews appear. Learn what AEO and GEO add to SEO, where they overlap, and how to frame the budget case for a CFO.
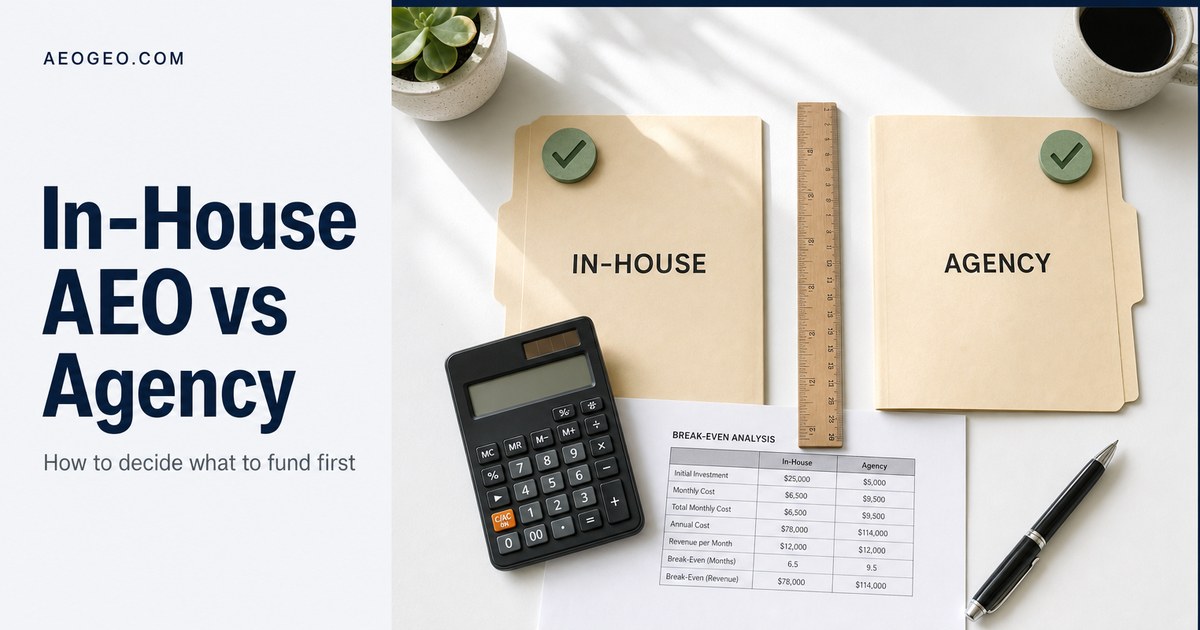
At $18K - $36K out before a verdict, an agency retainer is a real commitment. Here are the two gates to clear and the break-even arithmetic to run first.
A vendor-neutral scorecard for B2B SaaS revenue leaders: four criteria that separate credible AEO/GEO agencies from rebranded SEO retainers.
Request a quote and our experts will contact you within 24 hours with tailored solutions and pricing.
aeogeo.app
Last updated: Oct 21, 2026
By Ishan Manchanda, Co-Founder, GrowthSpree Ishan Manchanda is co-founder of GrowthSpree, a B2B SaaS marketing consultancy founded in 2017 that has managed $60M+ in ad spend across 300+ B2B SaaS companies. He focuses on demand generation, go-to-market strategy, and pipeline growth, and has been featured in Silicon Valley Times and SaaS Mag. LinkedIn
Disclosure: aeogeo.com is operated by GrowthSpree. GrowthSpree and Salient by GrowthSpree data are cited by name throughout with affiliation disclosed. All break-even and revenue-at-risk figures are illustrative, not financial advice.
TL;DR: An AEO ROI model calculates break-even deals as total spend divided by (ACV multiplied by gross margin), quantifies revenue at risk from AI click erosion, and defines 90-day citation indicators - giving B2B finance teams a defensible investment gate before pipeline appears.
If you searched for an SEO ROI calculator and your organic traffic assumptions have already been broken by AI Overviews, this is the model you need. Standard SEO ROI formulas depend on click and ranking inputs. Position-1 click-through rates have fallen 34.5% (Ahrefs, April 2025) and 58% (Ahrefs, February 2026, 300,000 keywords) when AI Overviews appear. The traffic model no longer justifies the spend.
Paid spend is frozen at many B2B companies for a concrete reason. Median CAC payback sits at 16 months - and 22 months at $50,000 - $100,000 ACV - according to the Aleph x Benchmarkit SaaS CAC Payback Benchmark 2026 (n=342). At the same time, 51% of B2B software buyers now start their research with an AI chatbot, up from 29% a year earlier (G2 software buyer behavior report, March 2026, n=1,076). Finance is right to ask for a compounding channel. This guide gives revenue leaders the complete arithmetic: the break-even formula, the Revenue-at-Risk Model, the 90-day leading indicators, the kill criterion, and the reallocation path. Every figure is labeled by source.
Key Takeaways
- AEO break-even = total spend divided by (ACV multiplied by gross margin). At $30,000 ACV and 75% margin, a $1,500/month program needs 0.4 closed deals; a $6,000/month program needs 1.6 deals (illustrative).
- Revenue at risk from AI click erosion ranges from 6.2% to 18.6% of total pipeline depending on organic share and erosion rate (illustrative, based on Ahrefs CTR data, April 2025 and February 2026).
- 90-day leading indicators - citation frequency on a fixed prompt set, AI-referred sessions in GA4, and self-reported attribution - give finance a measurable progress signal before pipeline appears.
- A kill criterion must be agreed before the program starts: if bot access is confirmed but citation frequency stays below threshold at 90 days with no attribution signals, pause and re-diagnose.
- Reallocation, not new budget: GrowthSpree's audits found 34.0% of Google Ads spend wasted across 104 accounts ($78.0M audited). That recoverable spend is the first place to look. (GrowthSpree affiliation disclosed.)
In this guide:
An AEO ROI model is a financial framework that measures return on an answer engine optimization program using citation frequency, pipeline attribution, and break-even deal counts - not traffic or rankings. Generic SEO ROI calculators fail because they depend on click inputs that AI Overviews have structurally reduced: position-1 CTR fell 34.5% in April 2025 and 58% by February 2026 when AI Overviews appear (Ahrefs). A different cost shape and different output metrics are required.

Answer engine optimization (AEO) is the practice of structuring content so that AI assistants and answer engines can fetch, parse, and cite it when a buyer asks a category question. Generative engine optimization (GEO) is the broader practice of optimizing content and technical infrastructure for AI-generated responses.
The standard SEO ROI calculator formula - revenue from organic traffic minus program cost, divided by program cost - breaks for AEO in three places:
A model built on traffic or rankings will undervalue AEO when traffic is suppressed by AI summaries. It will also overstate confidence by measuring last year's signal on this year's buying behavior.
The market rate for AEO programs runs from $999 to $6,000 per month on a six-month engagement. Practitioners on Indie Hackers quote $3,000 - $6,000 per month with 90-180 days to results (anecdotal). Salient by GrowthSpree, a managed AEO/GEO service (GrowthSpree affiliation disclosed), operates at $999 and $1,500 per month on six-month terms.
| Monthly Spend | 6-Month Total | Cash Out at 90 Days |
|---|---|---|
| $999/month | $5,994 | $2,997 |
| $1,500/month | $9,000 | $4,500 |
| $3,000/month | $18,000 | $9,000 |
| $6,000/month | $36,000 | $18,000 |
"Cash out at 90 days" = three months of spend before the first leading indicators are reportable. All figures illustrative.
Finance needs a distinct model for answer engine optimization (AEO) because cost shape, lag, and measurement units all differ from paid and SEO. Paid media produces attributable clicks within days, but median CAC payback already sits at 16 months - and 22 months at $50,000 - $100,000 ACV (Aleph x Benchmarkit 2026, n=342). AEO programs cost $9,000 - $36,000 over six months, and the output unit is citation frequency rather than a ranked click.

Three numbers illustrate the gap between what paid and SEO models capture and what AEO influences:
Dark funnel is the portion of buyer research that occurs in channels analytics cannot observe, including AI assistant conversations. AEO addresses dark-funnel influence; paid and SEO models cannot measure it.
The finance case for AEO is not a traffic model. It is a pipeline-protection and win-rate model. The question is not "what traffic does this generate?" but "what pipeline do we lose if we are absent from AI answers, and what does it cost to be present?"
CAC payback is the number of months required for a customer's gross margin contribution to recover the customer acquisition cost. At 16 months median (Aleph x Benchmarkit 2026, n=342), a channel that reduces CAC or extends deal value without proportional spend growth improves payback math directly.
The AEO break-even formula - and the core calculation in any SEO ROI calculator adapted for AI search - is: break-even deals = total program spend divided by (ACV multiplied by gross margin). At $30,000 ACV and 75% gross margin, a $1,500/month program ($9,000 total) requires 0.4 closed deals; a $3,000/month program ($18,000) requires 0.8; a $6,000/month program ($36,000) requires 1.6 deals. These are illustrative thresholds, not financial advice.

Break-even deals is the minimum number of incremental closed deals needed for total program cost to return to zero. It does not project revenue; it sets the minimum bar the model must clear.
| ACV | Gross Margin | $1,500/mo (6mo = $9K) | $3,000/mo (6mo = $18K) | $6,000/mo (6mo = $36K) |
|---|---|---|---|---|
| $15,000 | 75% | 0.8 deals | 1.6 deals | 3.2 deals |
| $30,000 | 75% | 0.4 deals | 0.8 deals | 1.6 deals |
| $50,000 | 75% | 0.24 deals | 0.48 deals | 0.96 deals |
| $100,000 | 75% | 0.12 deals | 0.24 deals | 0.48 deals |
Illustrative model based on Salient by GrowthSpree pricing tiers (GrowthSpree affiliation disclosed) and standard gross margin arithmetic. Not financial advice. Recalculate with your own ACV and margin.
The break-even number is not a forecast. It answers one question: given total spend, how many incremental influenced deals does the program need to produce for cost to equal zero? For a company closing 50 deals per year at $30,000 ACV, 0.4 to 1.6 incremental deals over six months is a low bar. For a company closing 10 deals per year at $15,000 ACV, 3.2 deals at the top spend tier is a material share of annual pipeline - and requires a tighter stage-gate.
Stage-gate is a go/no-go checkpoint at a defined date - typically 90 days - where leading indicator data determines whether the program continues to its next phase.
The Revenue-at-Risk Model for answer engine optimization (AEO) multiplies three factors: organic share of pipeline, share of organic queries showing AI answers, and the click erosion rate. At 30% organic share and 60% AI-exposed queries, a 34.5% erosion rate (Ahrefs, April 2025) puts 6.2% of total pipeline at risk; at 58% erosion (Ahrefs, February 2026) that rises to 10.4%. Scenarios with higher organic share are shown in the table below.
Revenue-at-Risk Model is the formula: organic share of pipeline multiplied by share of queries with AI answers, multiplied by click erosion rate. The output is the percentage of total pipeline at risk.
| Organic Share of Pipeline | AI-Exposed Query Share | Click Erosion Rate | Pipeline at Risk |
|---|---|---|---|
| 30% | 60% | 34.5% (Ahrefs, Apr 2025) | 6.2% |
| 30% | 60% | 58% (Ahrefs, Feb 2026) | 10.4% |
| 40% | 80% | 34.5% | 11.0% |
| 40% | 80% | 58% | 18.6% |
Ahrefs CTR data applied to illustrative organic pipeline shares. Not financial advice. Use your own organic share of pipeline as the first input.
With a concrete pipeline figure and your own organic share, the Revenue-at-Risk Model produces a dollar exposure - the numerator a CFO can compare directly against the AEO program cost. A company with $5,000,000 in annual pipeline and 30% organic share has $1,500,000 in organic pipeline at play. Apply the erosion rate scenarios from the table to get a range of pipeline at risk, then compare the AEO program cost against that range before presenting any ratio to finance.
The model has two honest limitations. First, the click erosion rates come from Ahrefs keyword studies across large samples, not from any individual company's own analytics. Second, organic share of pipeline is rarely tracked directly; most companies use organic sessions as a proxy, which overstates precision. Use ranges, not points. State those caveats explicitly in any finance review.
Our data: Salient by GrowthSpree reports 48,800 citations and $165,000+ pipeline across clients since launch in September 2026, and $70,000 in media-equivalent value (Salient pitch deck; unaudited; GrowthSpree affiliation disclosed). These are program-level aggregate figures, not per-client projections.
The 90-day leading indicators for an answer engine optimization (AEO) program are: citation frequency on a fixed prompt set (expressed as cited in X of N runs), AI-referred sessions in GA4, and self-reported 'AI assistant' attribution. Because AI recommendation lists almost never repeat across runs (SparkToro, 2026), a single prompt check is not a measurement. These three metrics give finance a progress signal before the 180-day pipeline gate.

Citation frequency is the share of prompt runs in which a brand is mentioned by an AI answer engine, expressed as cited in X of N runs on a fixed prompt set.
The Citation-to-Pipeline Ladder is a measurement framework with one metric per rung, running from infrastructure to revenue. Every rung must be confirmed before the next rung can be attributed.
| Rung | Metric | Method | 90-Day Target |
|---|---|---|---|
| 1 | Bot access | Server log or bot-analytics report | AI crawlers confirmed fetching key pages |
| 2 | Citation frequency | Fixed prompt set, 10+ prompts x 20+ runs | Trend line improving; report a range |
| 3 | AI-referred sessions | GA4 custom channel group: chatgpt.com, perplexity.ai, gemini.google.com, copilot.microsoft.com, claude.ai | Baseline established; sessions present |
| 4 | Self-reported attribution | 'AI assistant' value in how-did-you-hear-about-us field | Any positive responses logged |
| 5 | AI-influenced opportunities | CRM opportunities with AI attribution in source or notes | Count and ACV tracked |
| 6 | AI-attributed revenue | Closed deals with confirmed AI attribution | 180-day gate, not 90-day |
Method is the operative word at every rung. Finance will accept a number with a stated method; it will not accept a number without one.
Share of answers is the proportion of a fixed prompt set for which a brand is cited at least once, measured across repeated runs. The minimum defensible measurement is a fixed prompt set of at least 10 category-relevant queries, each run at least 20 times, reported as a range.
AI was 0.1% of referral traffic overall across 35,000 sites, yet approximately 3% of one company's own conversions, according to Ahrefs data. That gap is not a contradiction: AI influence shows up in self-reported attribution and win-rate data long before it appears as a tagged referral session in GA4. Report both, and state which signal precedes the other.
A kill criterion for an answer engine optimization (AEO) program is a pre-set, quantitative threshold that triggers program pause if not met by a defined date - agreed before the program starts. A defensible version covers three conditions: bot access is confirmed, citation frequency on the fixed prompt set is below threshold at 90 days, and no AI-referred sessions or self-reported attribution appear in the CRM. All three conditions must apply simultaneously to trigger a pause.

A kill criterion without a date is not a kill criterion. The table below shows a defensible structure for the 90-day checkpoint.
| Condition | Pass (continue) | Kill (pause) |
|---|---|---|
| Bot access | At least one AI crawler confirmed in server logs for key pages | Key pages blocked or unconfirmed after 30 days |
| Citation frequency at day 90 | Cited in at least 10% of prompt runs on the fixed set | Cited in 0% of prompt runs across two consecutive full runs |
| AI attribution signals | At least one AI-referred session or self-reported AI response in period | Zero AI-referred sessions and zero self-reported AI responses |
All thresholds are illustrative starting points. Set your own thresholds before the program begins, not after results appear.
The kill criterion is not a failure. It is the mechanism that makes the investment defensible. A program with a pre-agreed kill criterion is a controlled test; a program without one is an open-ended spend. Finance will fund the former more readily than the latter.
Re-diagnosis at 90 days follows the three-part Failure-Point Test: (1) can the machine read it - is bot access confirmed at the CDN/WAF and robots.txt level; (2) does it answer the exact question - are key pages structured in extractable, answer-first format; (3) is the source trusted - does the brand appear in third-party sources AI engines index. Most programs that fail at 90 days fail at rung 1 (bot access) or rung 2 (answer fit), not because the channel does not work.
Answer engine optimization (AEO) investment can often be funded by reallocation rather than new budget. GrowthSpree's audit data (affiliation disclosed) across 104 Google Ads accounts totaling $78.0M in audited spend found 34.0% wasted on non-converting terms. Across 56 LinkedIn Ads accounts ($9.4M in total audited spend), the waste rate was 32%. A company spending $10,000 per month on paid media may have $3,000 - $3,400 per month recoverable before requesting any net-new investment.
Our data: GrowthSpree's paid media audits found 34.0% of Google Ads spend wasted across 104 accounts ($78.0M audited) and 32% of LinkedIn Ads spend wasted across 56 accounts ($9.4M audited). The click-through rate to pipeline correlation in those accounts was r=0.09; cost per SQL correlation was r=0 (no correlation). (GrowthSpree data; affiliation with aeogeo.com disclosed.)
The reallocation argument runs in three steps:
The AEO ROI model on this page applies to B2B companies with an active, crawlable website and at least 50 annual opportunities above $15,000 ACV. It does not apply when AI crawlers are blocked at the CDN or WAF layer, below $1,000,000 annual revenue, to consumer businesses, or to companies whose pipeline is entirely referral-based. All break-even figures are illustrative and must be recalculated with your own ACV, margin, and program spend.
Additional caveats to state in any finance review:
All figures on this page are illustrative, not financial advice. Recalculate every input with your own ACV, gross margin, organic pipeline share, and program cost before presenting to finance.
All break-even and revenue-at-risk figures below are illustrative, not financial advice. Recalculate with your own ACV, gross margin, and program cost before presenting to finance.
Break-even deals equals total spend divided by (ACV multiplied by gross margin) - the same core formula as any SEO ROI calculator, adapted for AEO's six-month cost shape. At $30,000 ACV and 75% margin, a $1,500/month program (six months = $9,000) needs 0.4 closed deals; a $3,000/month program needs 0.8; a $6,000/month program needs 1.6 deals. At $100,000 ACV those thresholds fall to 0.12, 0.24, and 0.48 deals. All figures are illustrative - recalculate with your own inputs.
The Revenue-at-Risk Model multiplies three inputs: organic share of pipeline, share of queries showing AI answers, and the click erosion rate. At 30% organic share and 60% AI-exposed queries, a 34.5% erosion rate (Ahrefs, April 2025) puts 6.2% of total pipeline at risk; at 58% erosion (Ahrefs, February 2026) that rises to 10.4%. Use your own organic share as the first input. All figures are illustrative.
The three measurable 90-day leading indicators for answer engine optimization (AEO) are: (1) citation frequency on a fixed prompt set, expressed as cited in X of N runs; (2) AI-referred sessions tagged in GA4 via a custom channel group for chatgpt.com, perplexity.ai, and related domains; and (3) self-reported attribution showing 'AI assistant' in the how-did-you-hear-about-us field. All three precede pipeline impact and give finance a progress signal before the 180-day revenue gate.
A kill criterion for an answer engine optimization (AEO) program is a pre-agreed threshold that triggers program pause if not met by a specified date. A defensible version: if bot access is confirmed, citation frequency on the fixed prompt set stays below 10% after 90 days, and no AI-referred sessions appear in GA4, pause and re-diagnose. Set the criterion before the program starts, not after results disappoint.
Answer engine optimization (AEO) shares crawlability and content quality with SEO but has distinct incremental costs: per-bot access configuration, CDN/WAF review, answer-fit content design, and a separate measurement layer (the Citation-to-Pipeline Ladder). The incremental investment can often be funded by reallocation. GrowthSpree's audits found 34.0% of Google Ads spend wasted across 104 accounts ($78.0M audited), suggesting a significant share of paid spend is recoverable before any new money is needed. (GrowthSpree affiliation disclosed.)
Answer engine optimization (AEO) programs cost $999 - $6,000 per month on a six-month engagement ($9,000 - $36,000 total). At $30,000 ACV and 75% gross margin, break-even is 0.4 to 1.6 deals - achievable for most B2B companies running 50+ opportunities per year. Companies at ACV under $15,000 should start with minimum-viable steps: confirm AI crawler access, add 'AI assistant' to the lead form, and publish 10 answer-first pages before committing to a retainer.
AI recommendation lists almost never repeat across runs (SparkToro, 2026), so a single prompt check is statistically meaningless. A defensible citation frequency uses a fixed prompt set of at least 10 category-relevant queries, each run a minimum of 20 times, reported as a range: cited in X of N runs. Run the full set weekly for the first 90 days. Never report a single run as a citation rate.
The AEO investment case survives a CFO review when it is built on arithmetic, not marketing narrative. The break-even formula is total spend divided by (ACV multiplied by gross margin). The Revenue-at-Risk Model is three multiplications. The 90-day leading indicators - citation frequency, AI-referred sessions, and self-reported attribution - are measurable before pipeline appears.
Five points to carry into the finance review:
All models on this page are illustrative frameworks, not financial advice. Recalculate every figure with your own ACV, gross margin, organic pipeline share, and program cost before presenting to finance.
Continue learning: Related topics on aeogeo.com include AEO KPI benchmarks by segment, GA4 AI-referral attribution setup, the Failure-Point Test diagnostic, and the Buying Committee Query Map. Links will activate as those guides publish.
Get the weekly brief - AEO platform changes, benchmark updates, and measurement news for B2B revenue leaders, every week.
© 2026 aeogeo.app All rights reserved.