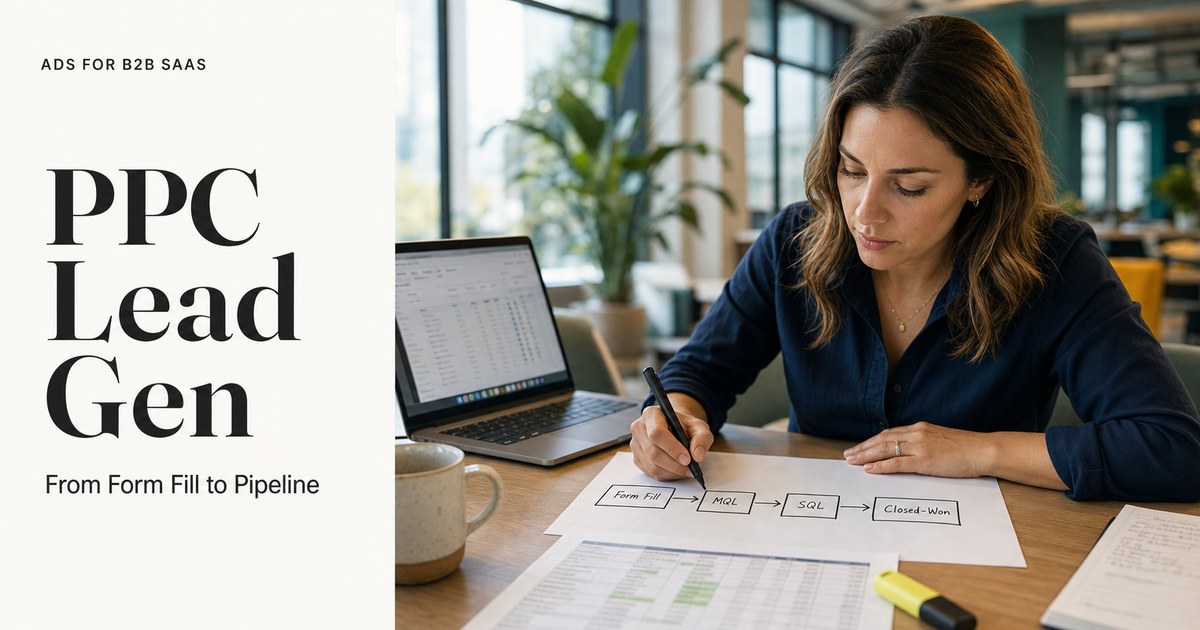
Last updated: Oct 13, 2026
PPC Lead Generation for B2B SaaS: How It Works and What Good Looks Like
By Ads for B2B SaaS Editorial Team | Last updated: October 13, 2026
The Ads for B2B SaaS editorial team covers paid media for B2B SaaS companies across Google Ads, LinkedIn Ads, and every major paid channel. Every figure in this guide is sourced from named studies with stated sample sizes and dates.
PPC lead generation for B2B SaaS is the practice of paying per click on search and social ads to move buyers toward a sales-qualified lead (SQL) - the metric that correlates with pipeline at r=0.71, versus r=0.23 for cost per lead (The Paid Ads Pipeline Disconnect, GrowthSpree, June 2026).
Most published guides on this subject were written for ecommerce. They stop at cost per lead and treat a low CPL as success. For B2B SaaS that framing is broken at the foundation: 78% of form fills never reach SQL status, and the median sales cycle runs 84 days across buying committees of 6 to 10 people. This guide reframes PPC lead generation around the SQL, using sourced benchmark data so an early-stage team can tell immediately whether their numbers are on track or broken.
Key Takeaways
- PPC lead generation for B2B SaaS is measured correctly only at cost per SQL, not cost per lead. CPL correlated with pipeline at r=0.23 across 1,412 ad variants; cost per SQL correlated at r=0.71 (The Paid Ads Pipeline Disconnect, GrowthSpree, June 2026).
- The median B2B SaaS cost per SQL is $800 to $2,500, with wide variation by vertical: DevTools averages $650, Cybersecurity averages $3,500 (SaaS Google Ads Benchmarks 2026, GrowthSpree, April 2026).
- 78% of form fills never reach SQL status - a low CPL almost always signals unqualified volume, not pipeline (The 2026 B2B SaaS Google Ads Waste Report, GrowthSpree, June 2026).
- The average Google Ads waste rate across 104 B2B SaaS accounts was 34.0%, roughly $255K per account per year. Broad match without negatives and Performance Max (PMax) without offline conversions account for 56% of that waste (GrowthSpree, June 2026).
- Fixing attribution is the first priority: 91% of audited accounts had no Google click ID (GCLID)-to-CRM connection, and PMax without offline conversions produced a cost per SQL of $2,140 versus $620 with them connected (GrowthSpree, June 2026).
How does PPC lead generation work for B2B SaaS?
PPC lead generation for B2B SaaS is the practice of paying per click on search and social ads to move buyers toward a sales-qualified lead (SQL) - not a form fill and not a cost-per-lead figure. Three structural differences separate it from ecommerce PPC: no purchase event, a median 84-day sales cycle, and buying committees of 6 to 10 people (The 2026 B2B SaaS Google Ads Waste Report, GrowthSpree, June 2026).

The structural difference between B2B SaaS PPC and ecommerce PPC
Ecommerce PPC ends at a transaction. The click, the cart, the purchase - the whole journey can complete in minutes, and return on ad spend (ROAS) is a sensible primary metric because revenue lands in the same session.
B2B SaaS PPC works differently in almost every dimension:
- Sales cycle: A median of 84 days from first click to closed-won (The 2026 B2B SaaS Google Ads Waste Report, GrowthSpree, June 2026). Dreamdata's Q1 2026 benchmark extended the average B2B path-to-purchase to 272 days and 88 touchpoints (Dreamdata, via Geisheker.com, 2026).
- Decision-makers: Buying committees of 6 to 10 people, each with different information needs.
- Conversion event: A form fill, a demo booking, or a free-trial signup - none of which represent revenue or a qualified sales opportunity on their own.
- Attribution: No direct purchase signal. The default 7-day click window captures only 5% to 15% of revenue against an 84-day sales cycle (The 2026 B2B SaaS Google Ads Waste Report, GrowthSpree, June 2026).
ROAS is not applicable to B2B SaaS PPC. The equivalent concept is cost per SQL, and calculating it correctly requires CRM data flowing back to the ad platform.
What channels run B2B SaaS PPC?
PPC lead generation channels for B2B SaaS include any ad platform where spend is paid per click or impression against a defined audience. The primary channels used in practice:
| Channel | Primary targeting mechanism | Typical B2B SaaS use case |
|---|---|---|
| Google Ads (Search) | Keyword intent | In-market demand capture |
| LinkedIn Ads | Job title, seniority, company size | Buying committee reach and awareness |
| Meta Ads | Behavioural and interest signals | Retargeting and brand awareness |
| Microsoft / Bing Ads | Keyword intent | Lower-CPC complement to Google |
| Reddit Ads | Subreddit and interest targeting | Developer, DevTools, MarTech verticals |
| YouTube Ads | Interest and in-market audiences | Mid-funnel video nurturing |
This guide covers the principles that apply across all channels. Channel-specific verdicts - when to choose Google over LinkedIn, how to structure a Reddit test - belong in the channel-by-channel comparison and vertical-specific benchmark guides.
Why does cost per lead fail as a success metric for B2B SaaS PPC?
Cost per lead (CPL) fails as a B2B SaaS PPC metric because it measures the wrong outcome. The Paid Ads Pipeline Disconnect study (GrowthSpree, 1,412 ad variants, 96 accounts, $14.2M spend, June 2026) found CPL correlated with pipeline at r=0.23-barely above random. The underlying problem: 78% of form fills never reach sales-qualified lead status, so a low CPL almost always signals volume rather than quality.
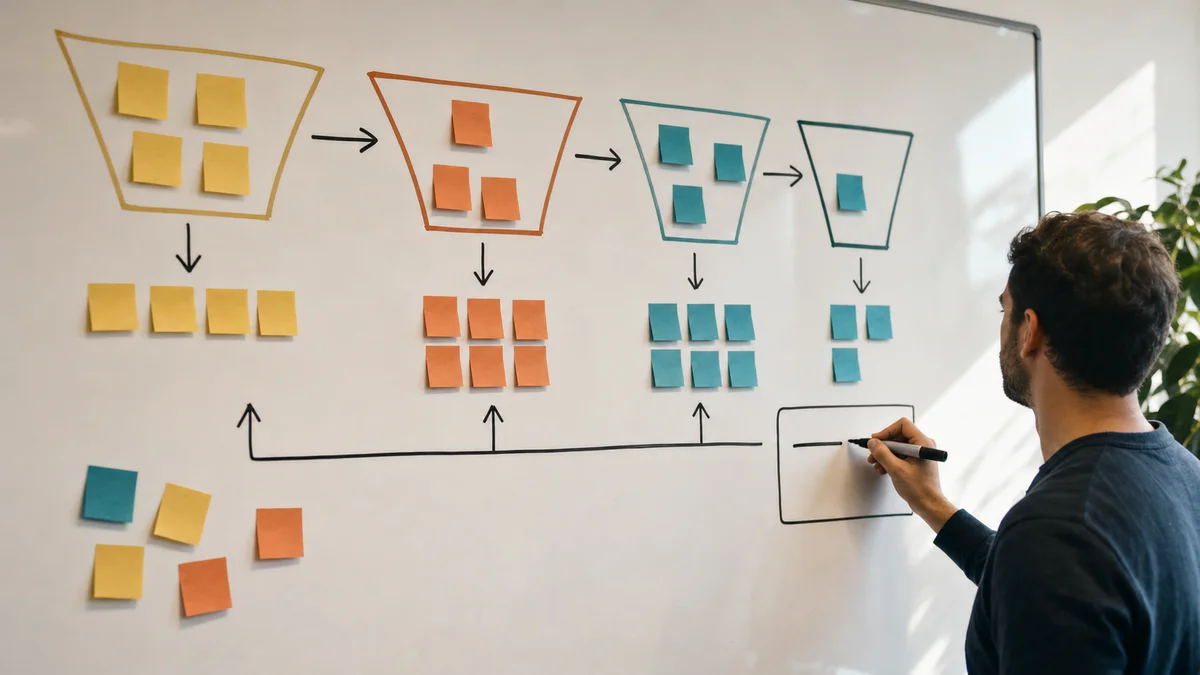
The vanity metric trap
Click-through rate (CTR) is an even weaker predictor. The same study found CTR correlated with pipeline at r=0.09-effectively no relationship. In 43% of A/B tests, the higher-CTR ad produced fewer or costlier sales-qualified leads (The Paid Ads Pipeline Disconnect, GrowthSpree, June 2026).
The consequence is predictable. Teams pause low-CTR ads and scale high-CTR ones. The dashboard looks healthy. The quarter ends short.
"A team that doubles CPL but triples SQL acceptance often lowers total CAC." (SalesHive editorial team, 2026)
That sentence captures the practical implication. A campaign with a $600 CPL converting at 40% to SQL produces a $1,500 cost per SQL. A campaign with a $200 CPL converting at 5% to SQL produces a $4,000 cost per SQL. The low-CPL campaign is more than twice as expensive per real opportunity.
Why CPL under-states the real cost
There is a second problem with CPL: it is usually miscalculated.
"Your dashboard CPL is probably 30-50% lower than your real CPL. Most teams forget to count software, labor, creative, and overhead." (Prospeo editorial team, 2026)
The figure that comes out of Google Ads or LinkedIn Campaign Manager is the media cost per form fill. It excludes agency or contractor fees, creative production, landing page tools, CRM licenses, and SDR time spent qualifying inbound leads. The real CPL is often 1.5 to 2 times higher than what the platform reports.
The metric hierarchy for B2B SaaS PPC
Use these metrics in this priority order:
- Cost per SQL (primary success metric)
- Cost per closed-won opportunity (when data volume allows)
- MQL-to-SQL conversion rate (to diagnose funnel health by channel)
- Cost per MQL (as a leading indicator, not a success metric)
- CPL / cost per form fill (operational only - not for success reporting)
- CTR and CPC (diagnostic only - never for optimisation decisions)
What does the B2B SaaS PPC funnel actually look like?
The B2B SaaS PPC funnel runs from ad click through form fill, marketing-qualified lead (MQL), sales-qualified lead (SQL), and on to closed-won - a sequence taking a median 84 days involving 6 to 10 decision-makers (The 2026 B2B SaaS Google Ads Waste Report, GrowthSpree, June 2026). PPC-sourced MQLs convert to SQL at only 26%, compared to 51% for SEO-sourced leads (First Page Sage, June 2025).

Funnel stage conversion rates by channel
Marketing-qualified lead (MQL) is a contact who has shown enough engagement - typically by completing a form - to be passed to sales for qualification. Sales-qualified lead (SQL) is a prospect that has met a defined set of criteria confirming it is worth pursuing for a direct sales conversation. The gap between the two is where most B2B SaaS PPC spend disappears.
The table below shows MQL-to-SQL conversion rates by lead source. All five rows come from First Page Sage B2B SaaS Funnel Conversion Benchmarks (June 2025), firstpagesage.com, covering B2B SaaS client data 2019 to 2025.
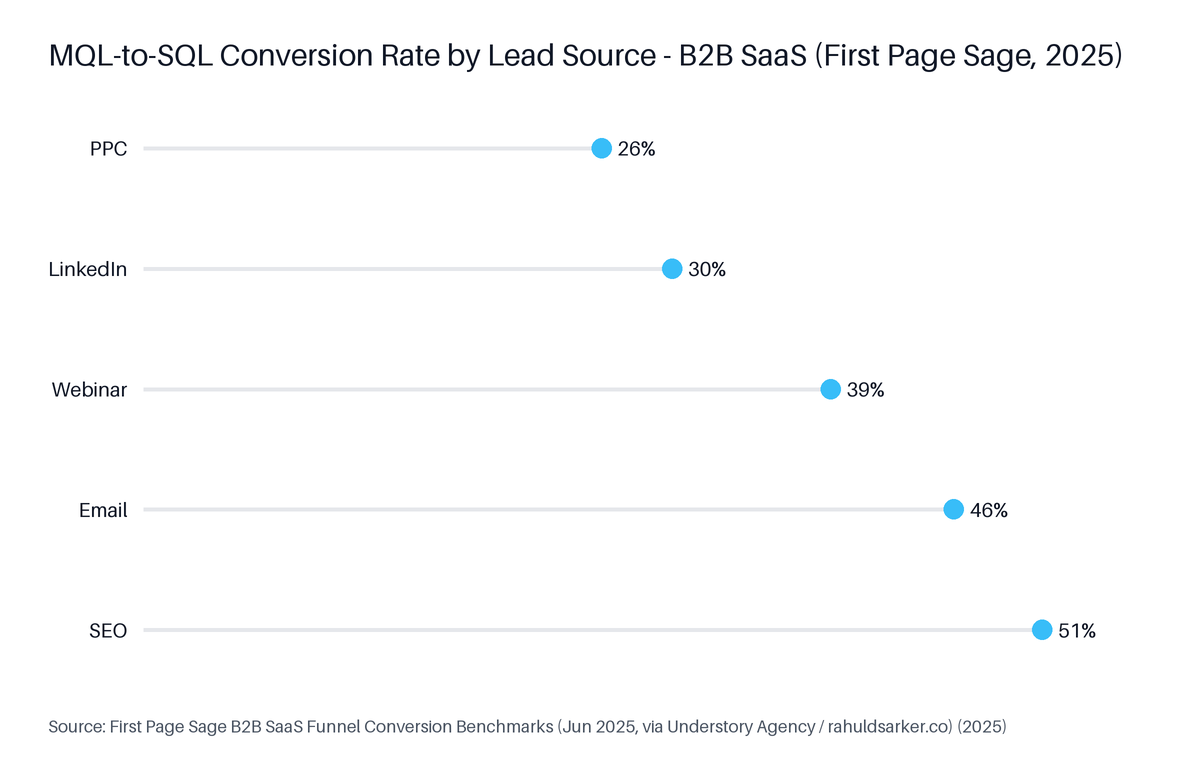
Source: First Page Sage B2B SaaS Funnel Conversion Benchmarks (Jun 2025, via Understory Agency / rahuldsarker.co), 2025
| Lead source | MQL-to-SQL conversion rate | Source |
|---|---|---|
| PPC (paid search) | 26% | First Page Sage, June 2025 |
| LinkedIn Ads | 30% | First Page Sage, June 2025 |
| Webinar | 39% | First Page Sage, June 2025 |
| 46% | First Page Sage, June 2025 | |
| SEO (organic search) | 51% | First Page Sage, June 2025 |
Source for all rows: First Page Sage B2B SaaS Funnel Conversion Benchmarks (June 2025), firstpagesage.com. Convenience sample of B2B SaaS client accounts, 2019-2025.
A PPC-sourced MQL requires roughly twice as many form fills to produce the same SQL count as an SEO-sourced lead. That does not make PPC the wrong choice - it makes the targeting and qualification layer more consequential. An ideal customer profile (ICP), which is a detailed description of the company type most likely to buy and retain the product, defines the audience targeting across paid channels. Running PPC against a poorly defined ICP is the fastest route to a high-volume, low-SQL outcome, compounding into a 2x to 4x cost-per-SQL penalty by the time the funnel reaches sales.
The dark funnel problem
"Buyers spend only 17 percent of their total purchase decision time meeting with potential suppliers." (Gartner, via Everything-PR, 2026)
The rest of the journey happens in channels that form-based attribution cannot see: community forums, peer Slack groups, review sites, and content consumed without a trackable click. Dreamdata's Q1 2026 benchmark found the average B2B path-to-purchase now runs 272 days and 88 touchpoints (Dreamdata, via Geisheker.com, 2026). Last-click attribution - the platform default - credits the final touchpoint with the full conversion and ignores everything before it.
For B2B SaaS PPC, this means:
- Form fills attributed to a single keyword are almost always under-attributing multi-touch journeys.
- Self-reported attribution ("how did you hear about us?") surfaces channels that last-click models miss entirely.
- Pipeline correlation - tracking which campaigns produce SQLs and closed-won deals - is more informative than any single-session conversion count.
What are the PPC benchmarks for B2B SaaS in 2026?
The median B2B SaaS non-brand cost per SQL is $800 to $2,500 and the median non-brand CPC is $8.50 to $14.00 on Google Ads (SaaS Google Ads Benchmarks 2026, GrowthSpree, April 2026). LinkedIn Ads CPCs run $8 to $25 by vertical, with cost per SQL ranging from $800 to $8,000 by annual contract value (ACV) tier (Wasted LinkedIn Ads Spend in B2B SaaS, GrowthSpree, June 2026).
Sourced benchmark data: The figures below come from two GrowthSpree studies: SaaS Google Ads Benchmarks 2026 (April 2026) and Wasted LinkedIn Ads Spend in B2B SaaS (56 accounts, $9.4M spend, June 2026). Both are convenience samples of B2B SaaS accounts active during the measurement period. Treat these as directional ranges, not guaranteed outcomes for any single account.

Google Ads benchmarks for B2B SaaS
Pipe Rocket Digital's August 2026 benchmark (own-account methodology, USD-normalised) recorded a B2B SaaS non-brand average CPC of $13.75, CTR of 3.60%, and conversion rate of 3.94%, producing a cost per form fill of roughly $207 (Pipe Rocket Digital, 2026).
"B2B SaaS Google Ads conversion rates rose ~48% year over year, the standout efficiency gain in the dataset." (Pipe Rocket Digital research team, 2026)
That efficiency gain is likely driven by AI bidding and offline conversion integration improving signal quality at scale. The B2B SaaS paid CPL - cost per form fill, not per SQL - sits at approximately $310 based on FirstPageSage data collected January 2022 to June 2025 across 30 industries (LeadSpot, citing FirstPageSage, October 2026).
Benchmark table by vertical and channel
| Vertical | Google Ads CPC | Google Ads cost per SQL | LinkedIn CPC range |
|---|---|---|---|
| DevTools | $7.50 | $650 | $8 to $25 |
| B2B SaaS median | $8.50 to $14.00 | $800 to $2,500 | $8 to $25 |
| Cybersecurity | $18.00 | $3,500 | $8 to $25 |
Source: SaaS Google Ads Benchmarks 2026 (GrowthSpree, April 2026); Wasted LinkedIn Ads Spend in B2B SaaS (GrowthSpree, 56 accounts, $9.4M spend, June 2026). Convenience samples. LinkedIn cost per SQL ranges from $800 to $8,000 by ACV tier.
LinkedIn ad format benchmarks
LinkedIn ad format efficiency varies substantially by type. Metadata's 2025 spend data across 138 advertisers found document ads delivered leads at a CPL of $142, compared to $200 for image ads, $265 for video ads, and $362 for conversation ads (Metadata.io, via Digital Applied, October 2026). Document ads at $142 versus conversation ads at $362-a difference of $220, or roughly 2.5x the CPL calculated from those same figures - is one of the most actionable format insights in the 2026 dataset.
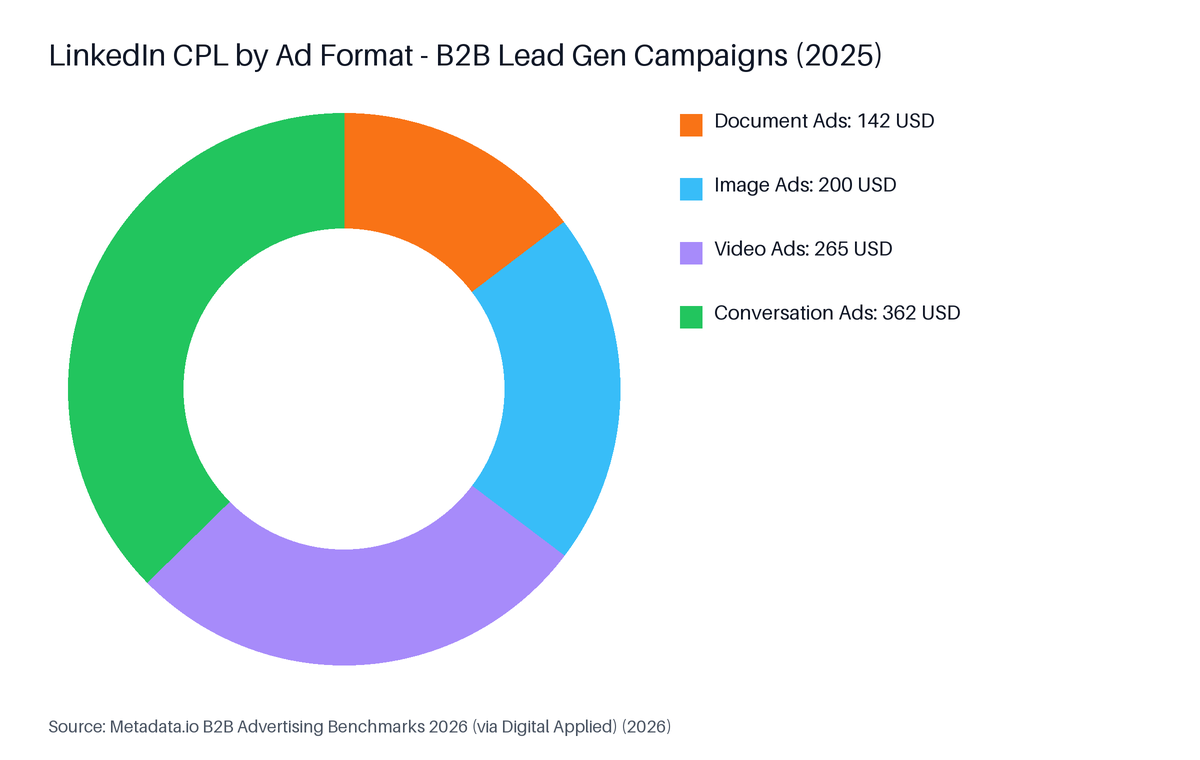
Source: Metadata.io B2B Advertising Benchmarks 2026 (via Digital Applied), 2026
Across all B2B channels in the same Metadata dataset (153 advertisers, $57.6M in 2025 spend), Google Ads produced leads at an average CPL of $524, compared to $202 for LinkedIn, $145 for Facebook, and $138 for Instagram (Metadata.io, via Digital Applied, October 2026). These are CPL figures, not cost per SQL. Cross-platform CPL comparisons are only meaningful when the same lead quality standard is applied across all channels.
How to tell if your numbers are on track or broken
| Metric | Top quartile | Median | Bottom quartile |
|---|---|---|---|
| Google Ads waste rate | 13.2% | 34.0% | 49.8% |
| Non-brand CPC (Google, B2B SaaS) | ~$8.50 | $8.50 to $14.00 | ~$18.00+ |
| Cost per SQL (Google, B2B SaaS) | ~$650 to $800 | $800 to $2,500 | $3,500+ |
| MQL-to-SQL conversion (PPC) | Above 26% | 26% | Below 15% |
| GCLID captured in CRM | Yes | No (91% do not) | No |
Source: The 2026 B2B SaaS Google Ads Waste Report (GrowthSpree, 104 accounts, $78.0M spend, June 2026); SaaS Google Ads Benchmarks 2026 (GrowthSpree, April 2026); First Page Sage B2B SaaS Funnel Conversion Benchmarks (June 2025).
Why do B2B SaaS PPC accounts waste so much budget?
B2B SaaS Google Ads accounts waste an average of 34.0% of spend - roughly $255K per account per year - across 104 audited accounts (The 2026 B2B SaaS Google Ads Waste Report, GrowthSpree, June 2026). Broad match without negative keywords and Performance Max (PMax) without offline conversions together account for 56% of that waste. On LinkedIn Ads, job function, seniority and company size targeting account for 67% of waste.
Sourced benchmark data: The 2026 B2B SaaS Google Ads Waste Report (GrowthSpree, 104 accounts, $78.0M spend, June 2026) found an average waste rate of 34.0% - roughly $255K per account per year. The best quartile wasted 13.2%; the worst quartile wasted 49.8%. The Wasted LinkedIn Ads Spend in B2B SaaS report (GrowthSpree, 56 accounts, $9.4M spend, June 2026) found an average LinkedIn waste rate of 32.0%, or approximately $53,600 per account. Both are convenience samples of B2B SaaS accounts.
The six most common waste sources in B2B SaaS PPC
Google Ads:
- Broad match without a negative keyword list. Broad match in 2026 expands aggressively. Without negatives, budget flows to tangentially related queries that fall outside the ideal customer profile.
- Performance Max without offline conversions. Performance Max (PMax) is a Google Ads campaign type that automatically allocates budget across all Google inventory using machine learning signals. Without CRM-sourced offline conversion data, PMax optimises toward whatever form fill or microconversion it can reach - often at 3x the SQL cost of a correctly configured account (The 2026 B2B SaaS Google Ads Waste Report, GrowthSpree, June 2026).
- Default attribution window. The 7-day click default is misaligned to a median 84-day sales cycle. 89% of audited accounts ran default attribution before their audit (The 2026 B2B SaaS Google Ads Waste Report, GrowthSpree, June 2026).
- No GCLID-to-CRM connection. Without the Google click ID (GCLID) - a unique parameter appended to landing page URLs on ad clicks - captured in the CRM, it is impossible to close the attribution loop between a clicked ad and a created SQL. 91% of audited accounts had no such connection (GrowthSpree, June 2026).
LinkedIn Ads:
- Over-broad demographic targeting. Job function, seniority, and company size are blunt instruments. LinkedIn's "Senior" seniority label includes a wide range of roles that do not align with the typical B2B SaaS buying committee - a primary driver of the 67% waste figure (Wasted LinkedIn Ads Spend in B2B SaaS, GrowthSpree, June 2026). Decision-makers received only 33% of LinkedIn budget in audited accounts, against a 60%-plus target.
- Under-funded tests. LinkedIn's learning algorithm requires sufficient conversion volume to exit the learning phase. Under-funded campaigns produce data that cannot be interpreted and consume the test budget without usable signal.
How does attribution break down for B2B SaaS PPC - and what does it cost?
B2B SaaS PPC attribution fails because 91% of audited accounts had no Google click ID (GCLID)-to-CRM connection and 89% ran default attribution before audit (The 2026 B2B SaaS Google Ads Waste Report, GrowthSpree, 104 accounts, June 2026). The default 7-day click window captures only 5% to 15% of revenue against an 84-day median sales cycle. Performance Max without offline conversions cost $2,140 per SQL versus $620 with them connected.
Sourced benchmark data: The 2026 B2B SaaS Google Ads Waste Report (GrowthSpree, 104 accounts, $78.0M spend, June 2026) found that Performance Max running without offline conversions produced a cost per SQL of $2,140, compared to $620 for accounts with offline conversions connected. Default 7-day click attribution captures only 5% to 15% of revenue against a median 84-day B2B SaaS sales cycle. These figures come from a convenience sample of B2B SaaS accounts audited in 2026.
Offline conversions is the practice of importing CRM events such as SQL creation or closed-won deals back into Google Ads as conversion signals, enabling the platform's bidding algorithms to optimise toward pipeline rather than form fills.
The attribution gap in numbers
| Attribution state | PMax cost per SQL | Attributed revenue coverage |
|---|---|---|
| Default (7-day click, no GCLID in CRM) | $2,140 | 5% to 15% of actual revenue |
| With GCLID in CRM and offline conversions | $620 | Proportional to sales cycle |
Source: The 2026 B2B SaaS Google Ads Waste Report (GrowthSpree, 104 accounts, $78.0M spend, June 2026).
What correct attribution setup looks like
The minimum viable attribution stack for B2B SaaS PPC has three components:
- GCLID captured in CRM on form submit. The click ID must be stored against the lead record at the moment of conversion.
- Offline conversions imported on a schedule. SQL creation and closed-won events are imported back to Google Ads - typically via API or CRM integration - on a daily or weekly cadence.
- Attribution window matched to the sales cycle. A data-driven model or a 90-day window is more appropriate than the 7-day default for most B2B SaaS accounts.
How do you optimise B2B SaaS PPC for pipeline, not just leads?
Optimising B2B SaaS PPC for pipeline means replacing form-fill volume as the bidding signal with cost per SQL, connected through CRM offline conversions. The Paid Ads Pipeline Disconnect study (GrowthSpree, 1,412 ad variants, June 2026) found re-scoring and reallocating budget by cost per SQL improved cost per SQL by approximately 44% with no additional spend. Three steps: close the attribution loop, score campaigns by SQL cost, then fix the two highest-impact waste sources.

Step 1: Close the attribution loop
Before any optimisation is meaningful, the tracking foundation must work:
- GCLID stored in the CRM on every form submission.
- SQL and closed-won events imported back to Google Ads as offline conversions.
- Attribution window extended to match the actual sales cycle, not the platform default.
Without this, every metric in the platform - including cost per SQL - is an estimate based on incomplete data. The 89% of accounts running default attribution before audit (The 2026 B2B SaaS Google Ads Waste Report, GrowthSpree, June 2026) were optimising against a signal that captured only 5% to 15% of actual revenue.
Step 2: Score every campaign and ad group by cost per SQL
Once attribution is working, cost per SQL becomes calculable at the campaign and ad-group level. Re-scoring and reallocating budget by cost per SQL improved cost per SQL by approximately 44% with no additional spend in the GrowthSpree dataset (The Paid Ads Pipeline Disconnect, GrowthSpree, 1,412 ad variants, June 2026). The process:
- Pull cost and SQL count by campaign and ad group over a 90-day window (to cover a full sales cycle).
- Rank campaigns by cost per SQL, from lowest to highest.
- Identify campaigns or ad groups where cost per SQL exceeds the top-quartile benchmark for the vertical.
- Pause or restructure under-performers before reallocating budget to top performers.
Step 3: Fix the two highest-impact waste sources
The 90-day fix that moved average Google Ads waste from 34.0% to 11.0% and cut cost per SQL by 62% (The 2026 B2B SaaS Google Ads Waste Report, GrowthSpree, June 2026) concentrated on two changes:
- Adding a structured negative keyword list to every broad match or smart bidding campaign.
- Connecting offline conversions to Performance Max and setting SQL - not form fill - as the primary conversion action.
These two changes account for 56% of documented waste in B2B SaaS Google Ads accounts. Addressing them first produces the largest return per hour of optimisation effort.
Ready to pressure-test your attribution setup? Meet with an expert - free consultation. Bring your ad account questions and talk through what good looks like for your vertical and deal size.
Who should not rely on PPC as a B2B SaaS lead generation channel?
PPC lead generation for B2B SaaS is a poor fit when attribution is broken - no GCLID in the CRM, no offline conversions flowing to the platform. PPC-sourced MQLs convert to SQL at only 26% (First Page Sage, June 2025), making payback harder at low annual contract values. LinkedIn's cost per SQL of $800 to $8,000 by ACV tier (Wasted LinkedIn Ads Spend in B2B SaaS, GrowthSpree, 56 accounts, June 2026) makes that channel difficult to justify for products with an ACV below $10K, where payback within 12 months is hard to achieve at standard B2B conversion rates.
Very early-stage companies with no product-market fit also risk burning runway without the conversion data needed to interpret results.
Specific situations where PPC is a poor fit
- No CRM in use yet. Without a CRM, the GCLID-to-SQL loop cannot close and attribution is impossible.
- ACV below $10K with a LinkedIn-only strategy. LinkedIn's cost per SQL floor makes payback difficult at low deal values.
- Under 90 days of runway to test. PPC lead generation with a median 84-day sales cycle needs at least one full cycle to produce interpretable SQL data.
- No dedicated budget for landing page development. PPC traffic converts at what the landing page earns. Sending paid traffic to a generic homepage wastes spend regardless of channel or targeting quality.
Frequently Asked Questions
What is a good cost per SQL for B2B SaaS PPC?
The SaaS Google Ads Benchmarks 2026 report (GrowthSpree, April 2026) puts the median B2B SaaS cost per SQL at $800 to $2,500, with wide variation by vertical. DevTools accounts average $650 per SQL; Cybersecurity accounts average $3,500. Accounts running Performance Max with offline conversions achieved $620 per SQL versus $2,140 for accounts running without them.
Why is CPL a misleading metric for B2B SaaS PPC?
Cost per lead correlated with pipeline at r=0.23 across 1,412 ad variants (The Paid Ads Pipeline Disconnect, GrowthSpree, June 2026). The problem: 78% of form fills never reach sales-qualified lead status, so a low CPL often signals volume rather than quality. With a median B2B SaaS sales cycle of 84 days, optimising on CPL pushes budget toward the wrong outcome.
Does CTR predict pipeline for B2B SaaS paid ads?
No. The Paid Ads Pipeline Disconnect study (GrowthSpree, 1,412 ad variants, 96 accounts, $14.2M spend, June 2026) found CTR correlated with pipeline at r=0.09-close to no relationship. In 43% of A/B tests, the higher-CTR ad produced fewer or costlier sales-qualified leads. Cost per SQL correlated with pipeline at r=0.71.
How much do B2B SaaS companies waste on Google Ads?
The 2026 B2B SaaS Google Ads Waste Report (GrowthSpree, 104 accounts, $78.0M spend) found an average waste rate of 34.0%, or roughly $255K per account per year. The best quartile wasted 13.2%; the worst wasted 49.8%. Broad match without negative keywords and Performance Max without offline conversions together account for 56% of documented waste.
What is a good CPC for B2B SaaS Google Ads?
The SaaS Google Ads Benchmarks 2026 report (GrowthSpree, April 2026) puts the median B2B SaaS non-brand cost per click at $8.50 to $14.00. DevTools is at the lower end at $7.50; Cybersecurity sits at $18.00. Pipe Rocket Digital's August 2026 benchmark recorded an average non-brand CPC of $13.75 across active B2B SaaS accounts.
Should B2B SaaS use Performance Max for lead generation?
Performance Max without offline conversions is one of the two largest drivers of Google Ads waste in B2B SaaS, according to the 2026 B2B SaaS Google Ads Waste Report (GrowthSpree, 104 accounts). Accounts running Performance Max without offline conversion data saw a cost per SQL of $2,140 versus $620 for accounts with offline conversions connected - calculated from the same study dataset.
What attribution window should B2B SaaS use for Google Ads?
The default 7-day click window captures only 5% to 15% of revenue for B2B SaaS companies with an 84-day median sales cycle (The 2026 B2B SaaS Google Ads Waste Report, GrowthSpree). The correct approach involves capturing the Google click ID (GCLID) in the CRM, importing closed-won and SQL data as offline conversions, and using a data-driven or longer attribution window matched to the actual sales cycle.
Is Google Ads or LinkedIn Ads better for B2B SaaS lead generation?
The right channel depends on annual contract value (ACV), sales cycle length, and audience size. Google Ads captures in-market demand at a median non-brand CPC of $8.50 to $14.00 (SaaS Google Ads Benchmarks 2026, GrowthSpree, April 2026). LinkedIn Ads reaches buying committees by job title and seniority but costs $8 to $25 per click and $800 to $8,000 per SQL by ACV tier (Wasted LinkedIn Ads Spend in B2B SaaS, GrowthSpree, June 2026).
Conclusion
PPC lead generation for B2B SaaS works when it is measured correctly. The core shift is from cost per lead to cost per SQL - a change that requires closing the attribution loop first, then using pipeline data to score and reallocate budget. The benchmarks are available: median cost per SQL of $800 to $2,500 on Google Ads, $800 to $8,000 on LinkedIn by ACV tier, and a top-quartile waste rate of 13.2% for accounts that have addressed the two primary sources of Google Ads inefficiency.
The practical starting point is not a channel decision. It is an attribution audit: is the GCLID landing in the CRM, and are SQL events flowing back to the platform? Without that foundation, every other optimisation is working with incomplete data.
Five things to take away:
- Cost per SQL (r=0.71) predicts pipeline. CPL (r=0.23) and CTR (r=0.09) do not.
- The median B2B SaaS Google Ads account wastes 34.0% of spend. Two fixes - negatives and offline conversions - account for 56% of that waste.
- PPC-sourced MQLs convert to SQL at 26% (First Page Sage, June 2025), versus 51% for SEO. Targeting and ICP alignment matter more than channel selection alone.
- Performance Max without offline conversions costs $2,140 per SQL; with them connected, the same campaign type costs $620.
- A 90-day window is the minimum to measure PPC results against a median 84-day B2B SaaS sales cycle.
Meet with an expert - free consultation. Bring your ad account questions and benchmark your numbers against what good looks like for your vertical and deal size.
Sources: The 2026 B2B SaaS Google Ads Waste Report (GrowthSpree, 104 accounts, $78.0M spend, June 2026) [G26]; Wasted LinkedIn Ads Spend in B2B SaaS (GrowthSpree, 56 accounts, $9.4M spend, June 2026) [L26]; The Paid Ads Pipeline Disconnect (GrowthSpree, 1,412 ad variants, 96 accounts, $14.2M spend, June 2026) [PD26]; SaaS Google Ads Benchmarks 2026 (GrowthSpree, April 2026) [B26]; 100+ Google Ads Benchmarks for B2B SaaS (Pipe Rocket Digital, August 2026); LinkedIn Ads Benchmarks 2026: CPC, CTR, CVR by Industry (Metadata.io, via Digital Applied, October 2026); B2B Cost Per Lead Benchmarks by Industry (LeadSpot, citing FirstPageSage, October 2026); B2B SaaS Funnel Conversion Benchmarks (First Page Sage, June 2025); Is Marketing Attribution Dead? (Dreamdata, via Geisheker.com, 2026); B2B Lead Benchmarks: Digital Marketing Gen (SalesHive, 2026); Cost of Lead Generation (Prospeo, 2026).
Note: GrowthSpree studies are convenience samples of B2B SaaS accounts active during the measurement period and may not represent all verticals or deal sizes equally. Sample sizes and spend volumes are stated above for each study.